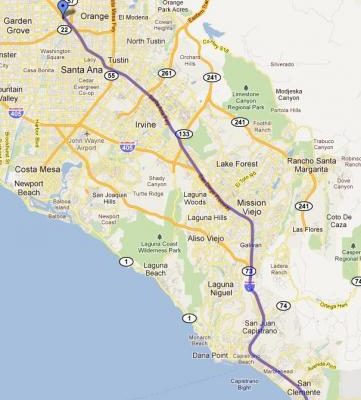
I-5 is a major North-South freeway corridor connecting Orange County and Los Angeles (LA) County. The corridor has four to five mixed-flow lanes and one HOV lane with full-time limited access along most sections. The study area is approximately 34 miles in length between the Chapman interchange in the north and San Diego/Orange County Line in the south. There are a number of major freeway-to-freeway system interchanges, including SR-73, SR-133, I-405, SR-55, SR-22, and SR-57. The corridor has good detector coverage, which has been installed to freeway mainline, on-ramps, and off-ramps.
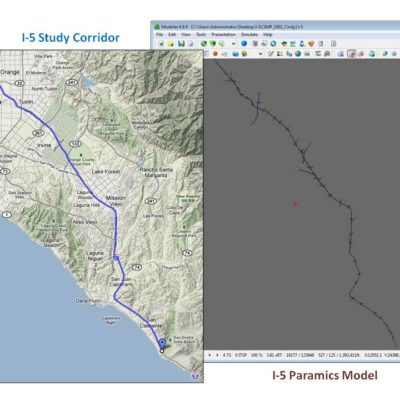
The corridor primarily consists of commuter traffic, and therefore, typical weekday morning and afternoon peak periods are of concern. The I-5 microsimulation model was built under Paramics v6.8.1 and was expected to reflect the typical traffic condition in the Fall quarter of Year 2010. The study area includes all freeway-to-freeway connectors of major interchanges, ramp terminal intersections, as well as adjacent arterial intersections. Inclusion of freeway ramp terminal intersections enabled accurate modeling of traffic signal platoon effects and queuing effects of freeway ramps.
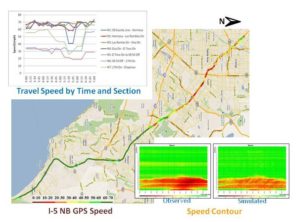
The model has a total of 125 zones, 69 traffic signals, and 86 ramp meters. It was calibrated primarily against volume, speed, and travel time data based on FHWA (Federal Highway Administration) microsimulation model calibration guideline. The traffic data were collected from Caltrans loop detection system through Caltrans Performance Measurement System (PeMS). Since the congestion levels varied from day to day, we employed the 50th percentile volume and speed measurements of a 29 day period (Tuesdays, Wednesdays, and Thursdays only) in Fall quarter of year 2010 from PeMS as the typical traffic condition. In addition, arterial turning data and freeway-freeway connector data, and GPS based travel time data were collected in 2011. We collected 23 intersections’ turning movement data due to the budget limitation. For the remaining intersections, we used historical turning data collected in Year 2005 and 2006. We also collected freeway-freeway connector data since Caltrans’ detection system did not cover these high-volume connectors or report accurate data along these connectors.
ongested freeway with multiple bottlenecks during the AM and PM peak periods. The high truck volume, seven major freeway-to-freeway interchanges, and buffer-separated HOV (High-Occupancy Vehicle) facilities have made it even more challenging for model building and calibration. Paramics was chosen in this project for its user friendly network editor for efficient and accurate network coding, advanced functionality for customizing vehicle/driver behaviors, powerful traffic assignment methods, ability to reflect reasonable volume-occupancy diagram based on simulated detector data, and the flexibility to integrate customized features by accessing and modifying the underlying simulation model through implementing plugins.
For this project, we encountered and overcome the following challenges:
The simulation results from this project can provide important information for stakeholders on decision making. Based on the calibrated model, we evaluated the performance of seven alternative scenarios under both baseline demands and horizon demands. The scenarios we evaluated corresponded to near-term programmed projects, medium-term programmed projects, and suggested projects, which included different strategies such as adding mainline general-purpose lanes and/or auxiliary lanes, HOV lane conversion from limited-access to continuous-access, adaptive ramp metering, and incident management. The performance of these scenarios were quantified through speed contour maps, and various MOEs including Vehicle Miles Traveled, Vehicle Hours Traveled, and delay.
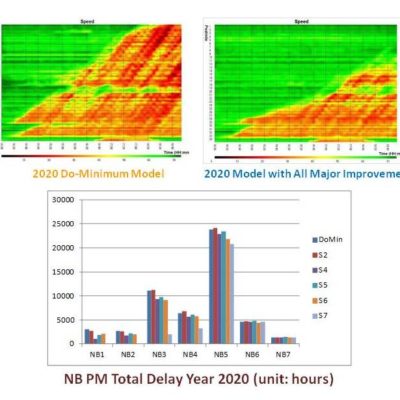
The evaluation results clearly show how the projects in these scenarios influence the performance of the study corridor. It is found that
Not all future demands can be served during the AM and PM peak periods while those that traveled on the corridor experience a much higher delay compared to the existing conditions.
Northbound I-5’s congestion will not be effectively relieved, mainly because the improvement project for the portion of freeway from SR-55 to SR-57 is not enough.
Some improvement projects may resut in negative impacts to the study corridor. For example, some interchange improvement projects bring more vehicles and more congestion to the freeway.
Through this project, we successfully demonstrated to the stakeholders that microsimulation is an efficient tool for evaluating complex freeway and roadway systems and investigating the effects of different improvement alternatives. In the future, the models developed under this project can be applied to evaluate various improvement strategies, as well as various future year travel demand conditions. Application of the models can be used to help identify freeway bottleneck locations, level of congestion/freeway queues, travel time variations and reliability, freeway travel speeds, and various system-wide vehicle and passenger performance measures.
Prime Contractor: System Metrics Group (SMG)
Project Sponsor: Caltrans
Project Time Period: May 2011 – April 2012