The light rail along Crenshaw Blvd will have light rails operated above the ground between north of 48th and south of 59th St. This project aims to develop a microscopic traffic simulation model to simulate vehicles, light rails and pedestrians for the study area. The model can be used to analyze the transit design and its operation, optimize the signal control, and investigate the interactions among vehicles, light rails and pedestrians.
As shown in the figure below, the main modeling area for the Crenshaw project extends from 48th St. in the north to 60th St in the south. All major intersections within the stretch of Crenshaw are included in the model. In addition, the whole light rail under the study and a portion of the green line (between Hawthorne and El Segundo stations) are included in the model in order to reserve the capabilities to analyze the light rail operation and the interaction between the light rail and the green line.
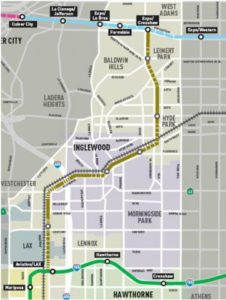

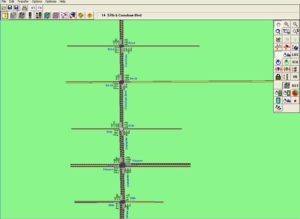
Figure. The VISSIM Model (Left: model overview; Right: model focus area along Crenshaw)
The simulation model was developed for one AM peak hour and one PM peak hour based on the observed traffic data from the field. All signals were modeled using the Ring Barrier Controller (RBC) signal control module. Transit priority was added to the model to allow light rail to have less delay.
There were two signal timing scenarios, which were obatined through Synchro’s optimization. One is with 120 sec cycle length and another is with 150 sec cycle length. The synchro network for the study area is shown in the figure below. Both scenarios were implemented in the model, simulated, and then compared against each other.
Project Time Period: March – April 2011
Prime Contractor: Hatch Mott MacDonald
Client: LA Metro