Traffic Monitor HD provides a complete traffic data collection, storage, analytics and visualization solution. It provides accurate traffic detection data from a single inductance loop. It is capable of traffic system performance , and emission estimates in the intersection, corridor, and system levels through multiple levels of our product lines. It can also serve as a data source to improve the existing data reporting system such as PeMS in California.
Our solution is scalable and customizable to assist traffic agencies with their daily business on design, planning, operation, safety, and maintenance. Customers receive confidence in data reporting accuracy, comprehensiveness over the whole roadway, which in turn improves efficiency and accuracy on data-driven based activites.
The plugin utilizes the API functions from TransModeler to perform the following functions:
San Diego experiences significant traffic congestion during peak travel periods, has limited HOV and HOT lanes, and has limited transit capacity. Potential solution is to increase multi-jurisdictional and multi-agency collaboration on corridor management. The San Diego I-15 corridor was chosen as a site for Analysis, Modeling and Simulation (AMS) of Integrated Corridor Management (ICM) strategies. One strategy proposed by the study team is coordinated ramp metering control.
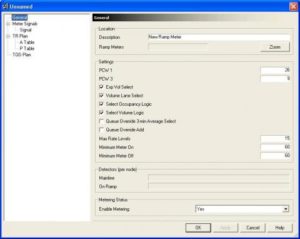
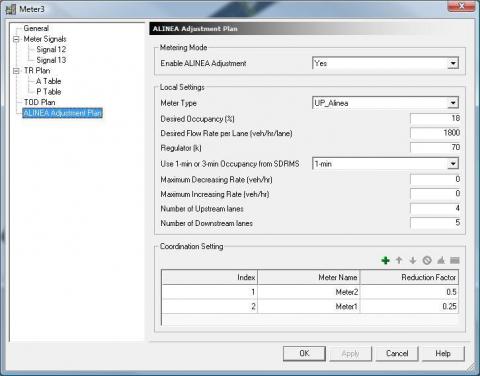
This plugin implements the ALINEA ramp metering algorithm in PARAMICS. The ALINEA algorithm, proposed by Papageorgiou et al, is a local feedback ramp metering strategy, which attempts to maximize mainline throughput by maintaining a desired occupancy on the downstream mainline freeway. Compared to other traffic-responsive ramp metering algorithms, ALINEA is remarkably simple, highly efficient, and easily implemented. According to the results from field tests and simulation-based studies, ALINEA has very good performance.
This plugin implements the TOS (Traffic Operations System) ramp metering algorithm in PARAMICS. The TOS is one of the most widely used ramp metering systems in California. It is currently deployed in District 4 (Bay Area). The TOS can be operated under traffic-responsive or pre-timed metering control. It has two traffic responsive control logics, which are occupancy logic and volume logic. Under traffic responsive control, a meter can be operated under volume logic or occupancy logic. If both occupancy and volume logics are enabled, the most restrictive of the two rates is applied.
This plugin implements the SDRMS (San Diego Ramp Metering System) ramp metering algorithm in PARAMICS. The SDRMS is the most widely used ramp metering systems in California. It is currently deployed in District 3 (North Central), District 8 (Riverside/San Bernardino), and District 11(San Diego/Imperial). The SDRMS can be operated under traffic-responsive or pre-timed metering control. It has two traffic responsive control logics, which are occupancy logic and volume logic. If both occupancy and volume logics are enabled, the most restrictive of the two rate codes is applied.
This plugin implements the SATMS (Semi Actuated Traffic Metering System) ramp metering algorithm in PARAMICS. The SATMS is one of the ramp metering systems used in California. It is currently deployed in District 7 (Los Angeles) and District 12 (Orange County).The SATMS can be operated under traffic-responsive metering control or pre-timed metering control. The theory behind the traffic-responsive metering control of the SATMS is based on demand-capacity control.The SATMS provides two sets of metering parameters, which are referred to as “plan A” and “plan B”. The plan in use at any given time is selectable via time-of-day (TOD) table entries (see picture below) or via communications.
The plugin utilizes the API functions from VISSIM to perform the following functions:
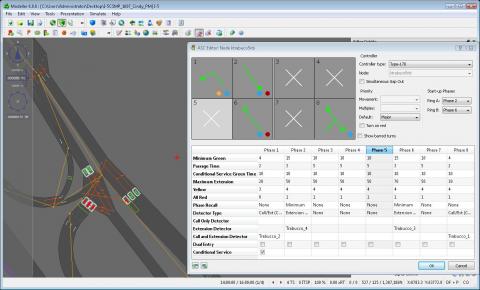
Engineers in CLR Analytics have accumulated profound actuated signal control knowledge through various academic and practical projects. We even developed a couple versions of actuated signal control plugins under Paramics during the last decade. The collaboration between Quadstone Paramics and CLR Analytics allows Paramics to have a actuated signal control module that meets the expectation from modelers and traffic enginneers. In this effort, CLR Analytics provided the NEMA and 170/2070 control logic and some preliminary GUI design to Quadstone Paramics for the development of the actuated signal control module. CLR Analytics also provided a few rounds of testings to make sure the logic has been implemented correctly.
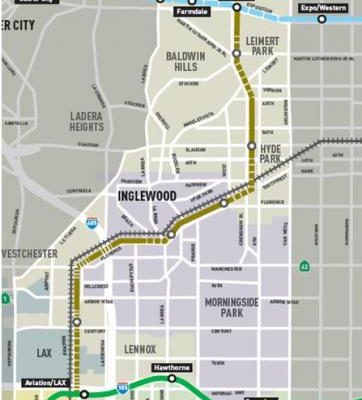
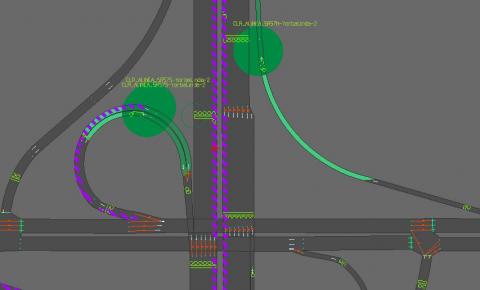
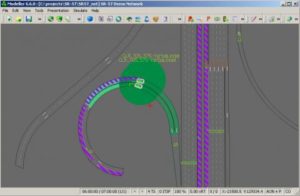
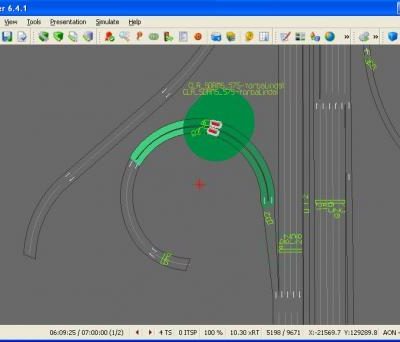
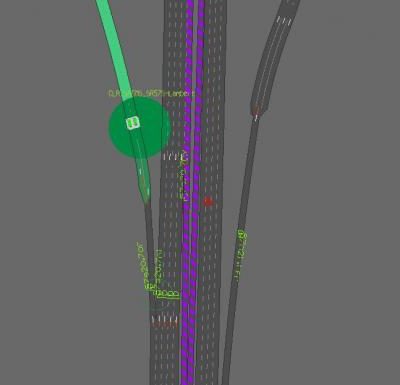
The light rail along Crenshaw Blvd will have light rails operated above the ground between north of 48th and south of 59th St. This project aims to develop a microscopic traffic simulation model to simulate vehicles, light rails and pedestrians for the study area. The model can be used to analyze the transit design and its operation, optimize the signal control, and investigate the interactions among vehicles, light rails and pedestrians.
As shown in the figure below, the main modeling area for the Crenshaw project extends from 48th St. in the north to 60th St in the south. All major intersections within the stretch of Crenshaw are included in the model. In addition, the whole light rail under the study and a portion of the green line (between Hawthorne and El Segundo stations) are included in the model in order to reserve the capabilities to analyze the light rail operation and the interaction between the light rail and the green line.